Its fun to share new results and updates on progress. Today is one of those days. I have been busy putting together the first UHI chapter of my dissertation and getting it ready for publication. This is a sneak peak.
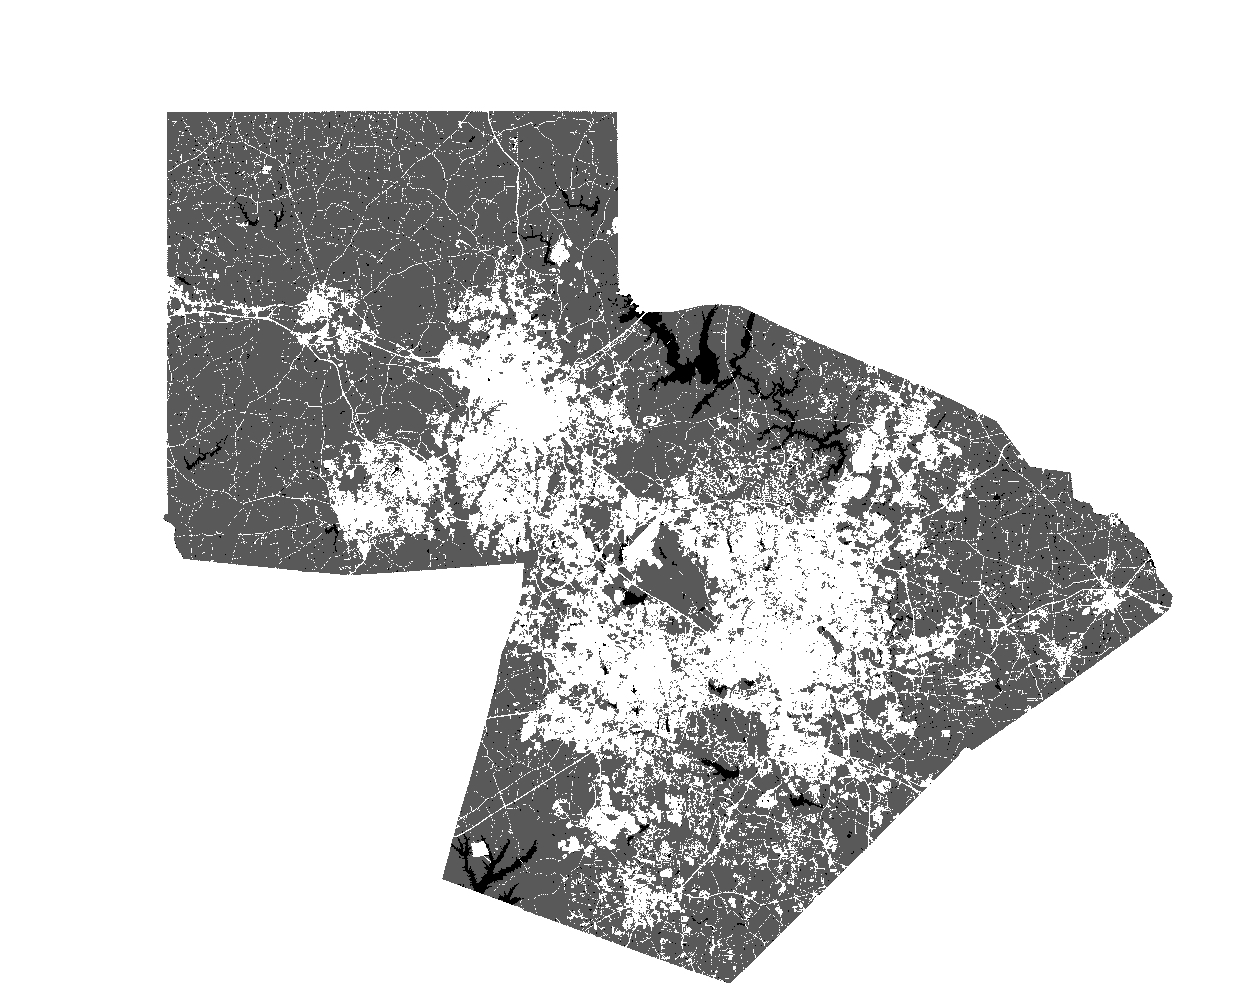
The figure above shows the distribution of the urban and rural land cover classes in Orange, Durham and Wake Counties of North Carolina. These distributions were found by aggregating 20 land cover types from the NLCD 2011 data product into two groups: urban (white) and rural (dark gray). Open water appears black. Using GIS software and a thermal image of the study area taken from the Landsat-8 satellite, I calculated the average temperature of the two different land classes for a hot summer afternoon earlier this year (June 21, 2015, 3:52pm). The temperature of the rural land cover in this image is 2.1 degrees Celsius cooler than the urban areas. Additional results and a detailed analysis will appear in the chapter and publication.
I also posted this image to the maps section of my website. Check it out!
