The Regional UHI

Its fun to share new results and updates on progress. Today is one of those days. I have been busy putting together the first UHI chapter of my dissertation and getting it ready for publication. This is a sneak peak.

The figure above shows the distribution of the urban and rural land cover classes in Orange, Durham and Wake Counties of North Carolina. These distributions were found by aggregating 20 land cover types from the NLCD 2011 data product into two groups: urban (white) and rural (dark gray). Open water appears black. Using GIS software and a thermal image of the study area taken from the Landsat-8 satellite, I calculated the average temperature of the two different land classes for a hot summer afternoon earlier this year (June 21, 2015, 3:52pm). The temperature of the rural land cover in this image is 2.1 degrees Celsius cooler than the urban areas. Additional results and a detailed analysis will appear in the chapter and publication.

I also posted this image to the maps section of my website. Check it out!

Submitted

I submitted my first paper to an actual journal today. Feels a little like a celebration is in order. Feels a little like I should wait to celebrate until I hear back from the journal. I might hedge my bets because regardless of the outcome of the editorial process that is about to unfold, this point in time deserves a little moment of pause. I submitted an academic paper to an academic journal today.

The paper in question has been in progress for almost three years and is nothing resembling the paper I started writing. It represents a process of learning, collaboration and debate that I could not have predicted when I started. It says something different than I set out to say, something much smaller, but perhaps also larger than I have any experience to appreciate. It was hard to write. I had to step away from it many times to be renewed and reinvigorated to continue the work of creating it. It is not perfect.

But it was time to let it go. Let it go. And see if it has legs.

Today, I submitted my first paper to an academic journal.

Transecting

Looking for something fun to do on a Friday night? Maybe a beer with friends after work, grab a bite to eat, catch a show or a late night hang at the bar… movie night with the kiddos… how about driving back and forth across Durham County collecting temperature data?! It’s all for the fun of science.

But I digress… Thursday night was build-out. The idea is to get an external temperature and relative humidity sensor attached to the car at approximately 2 m (6 ft) height and out of the slip-stream of the car so I can drive the sensor around measuring the ambient environment. The data will be correlated to GPS data collected at the same time so I can start to unravel the correlation of temperature with urban form.

The design required an old 2-by-4, in this case harvested from an old renovation project around the house, and a two foot section of 4″ PVC pipe, also left over from a house project. Using a circular saw and drill, a seat for the external HOBO sensor and a notch for the chord were created in the end of the 2-by-4. The sensor was installed in its home and the chord stapled down to the beam using chord staples. Of course we have a chord stapler. Who doesn’t?

image

The PVC pipe was installed over the sensor after a bit of electrical tape was wrapped around the sensor for good measure to make sure it didn’t move in the wind. Then I drilled out two sets of 4 holes in line with the location of the roof rack bars so zip ties could be used to attach the rig. In addition to the zip ties, I ended up using a ratchet strap to keep the whole thing in place, again, just for good measure. Once installed on the car, the sensor body drops through the sun roof so I can launch and download data inside the car.

The set up looks a little home-made, and it is. I was thinking I needed to create a hashtag: #NotAGoogleCar… but it’s probably pretty obvious.

image

With the mount ready, and the weather window open, it was time to get transecting! (Yes, I made a verb out of transect.) Starting at 6 am on Friday morning, I drove the predefined route every 4 hours (6 am, 10 am, 2 pm, 6 pm, 10 pm, 2 am). Each run to Durham and back took an average of 1:45, and was 46 miles. That totals up to some 280 miles and about 10 hours of driving. On each run, I collected temperature, relative humidity and GPS data every second. That’s a lot of data! That’s a lot of NPR.

image

With raw data in hand, its time to get processing, but first I have to rest up for the next round of transecting… possibly as soon as Monday. Because the fun doesn’t stop when science walks in…!

Weather Watch

Now that the sensors are out in the field happily logging away, it’s time to watch the weather so the next phase of the 2015 Summer Field Campaign can kick into gear.

I’m looking for ideal UHI conditions: calm winds, clear skies, no precipitation… for several days in a row. This weather pattern allows the thermodynamic processes that create the heat island to take shape without being obscured by additional, hard to model factors in the atmosphere. It’s the ideal time to take measurements, and I’m looking for a 48+ hour period of good weather to complete the transect phase of the campaign which will require driving the transect (see Maps Page) every 4 hours for 24 hours.

A window may be emerging…

2015_06_10_DurhamWeatherForecast

But it also maybe not… the forecast not only keeps changing, the wind profile is a bit high, and the threat of rain could put the whole thing off.

So for now, I wait, and watch the weather.

…Oh! And build a sensor mount for the car so I’m ready when the weather is!

Stay tuned.

Science is happening NOW.

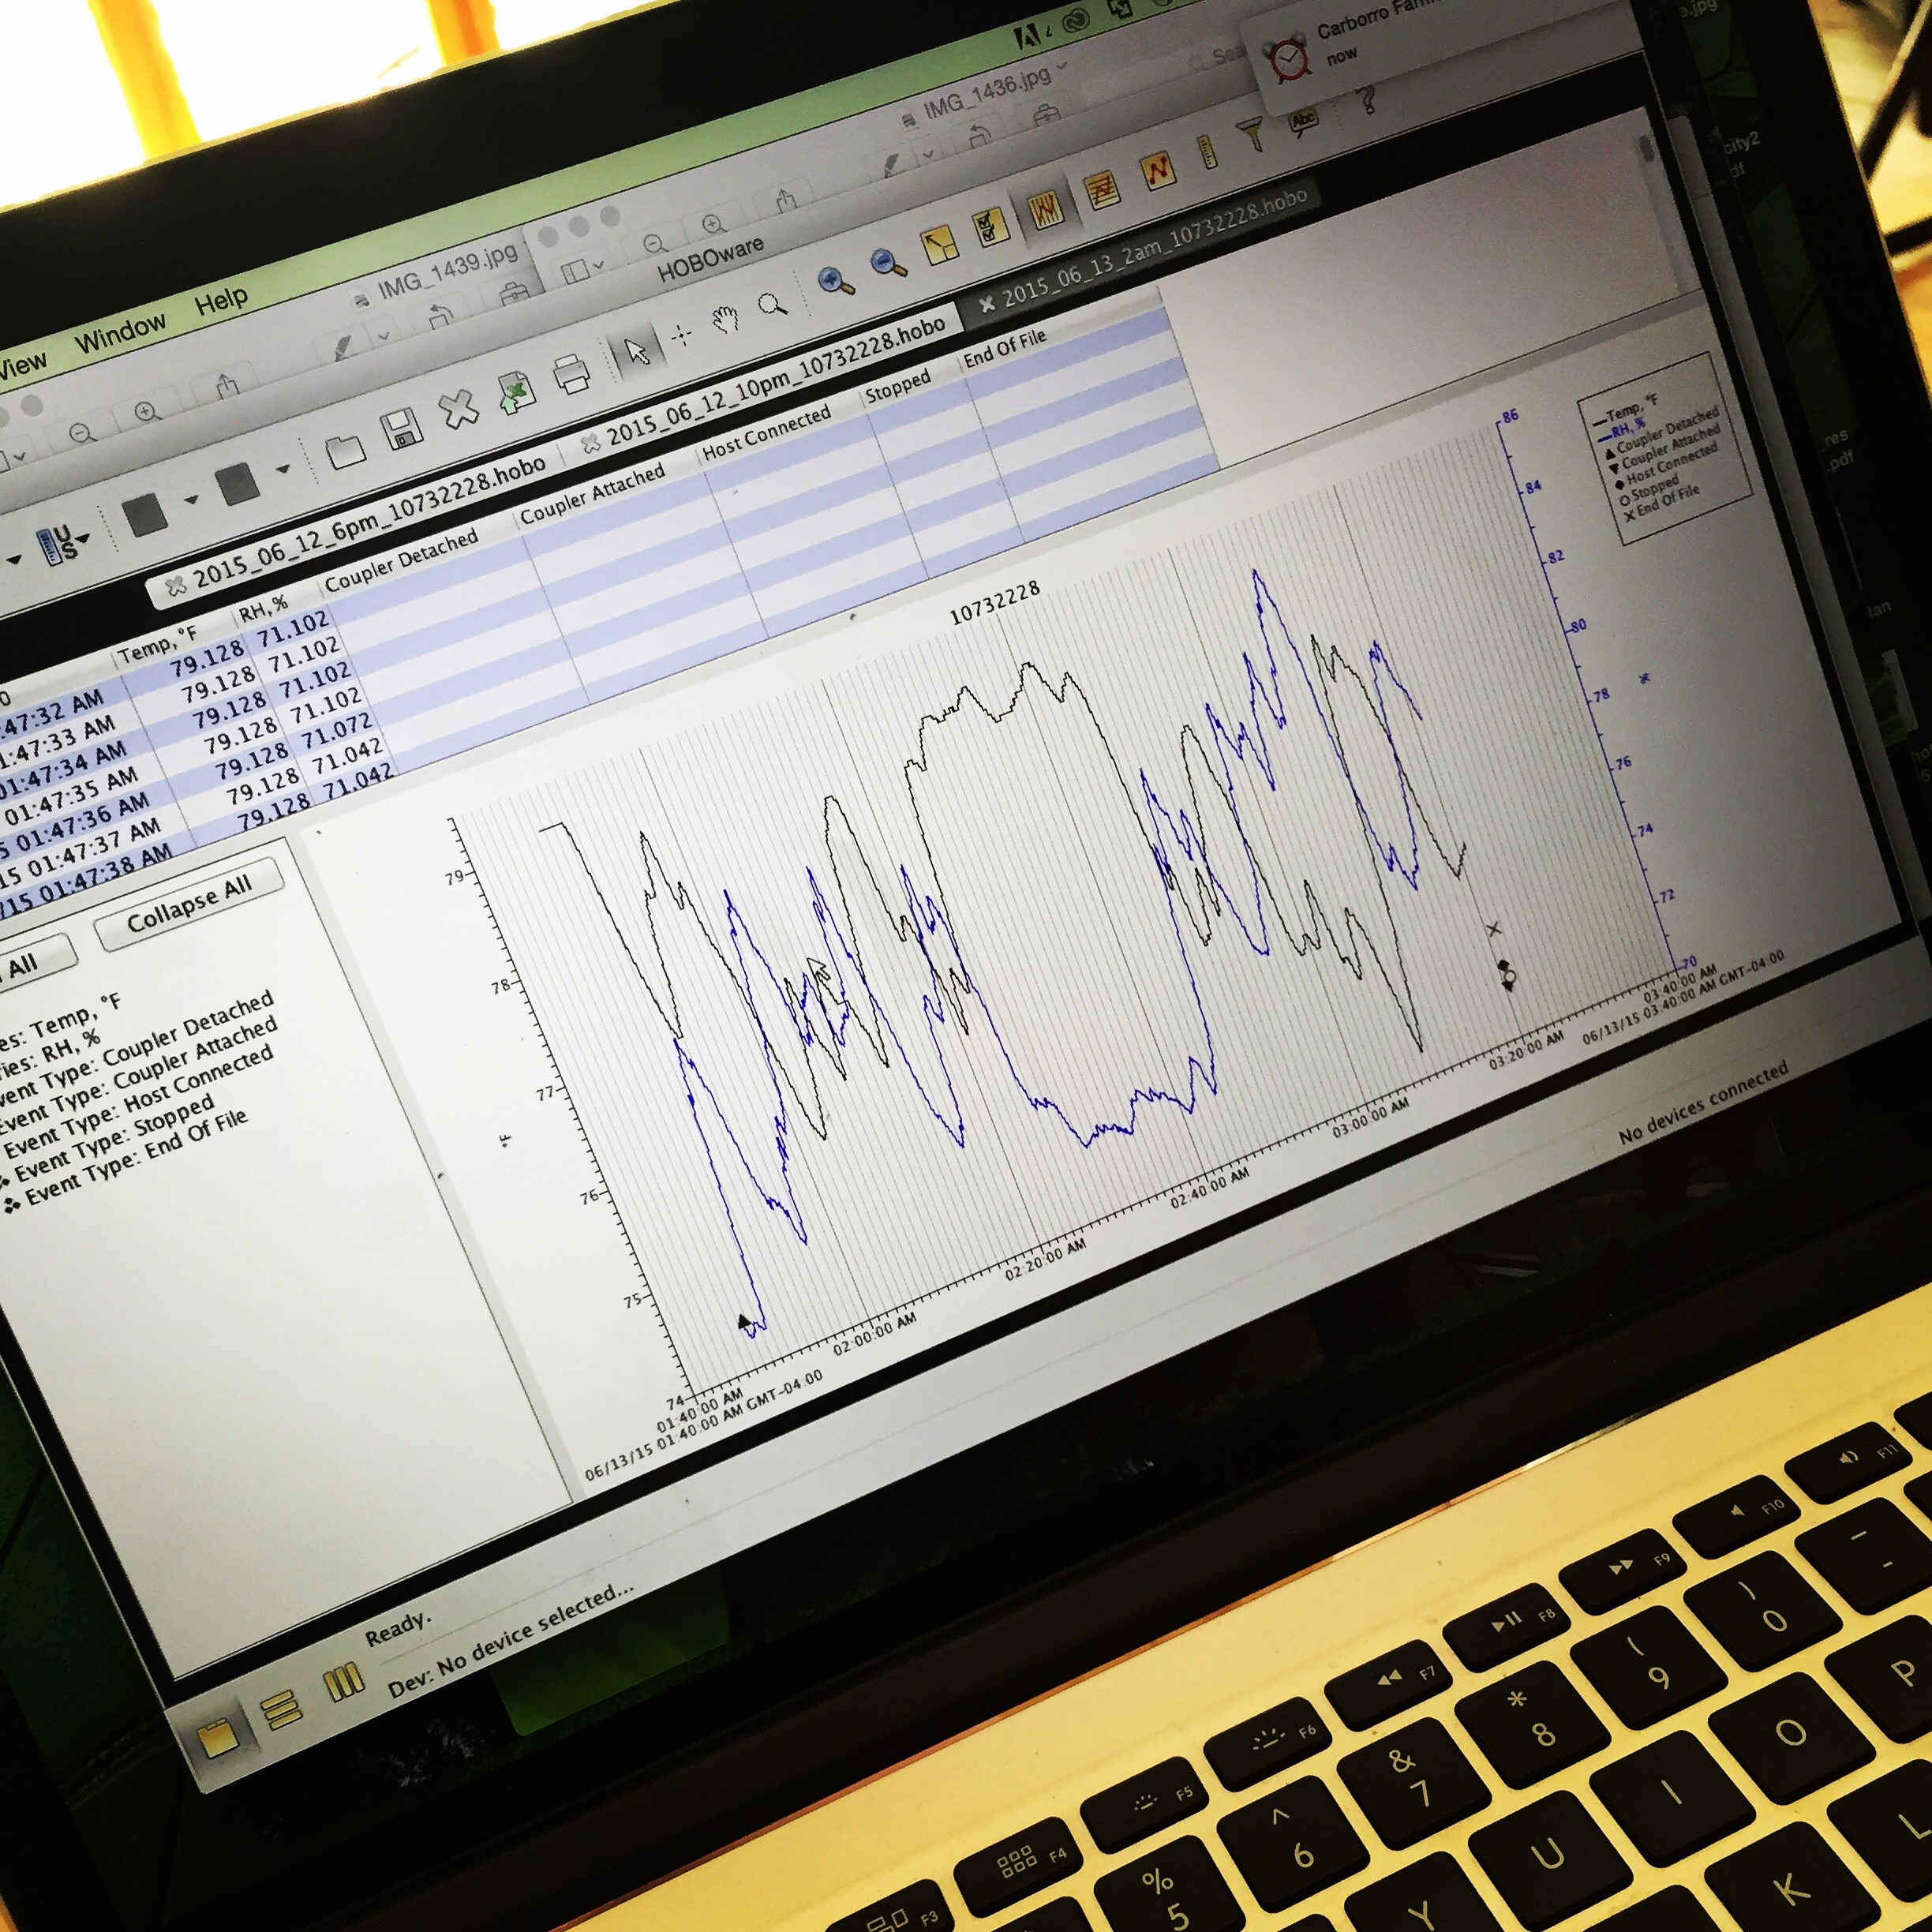
The stationary sensor network is in place, and it’s been a busy week making that happen.

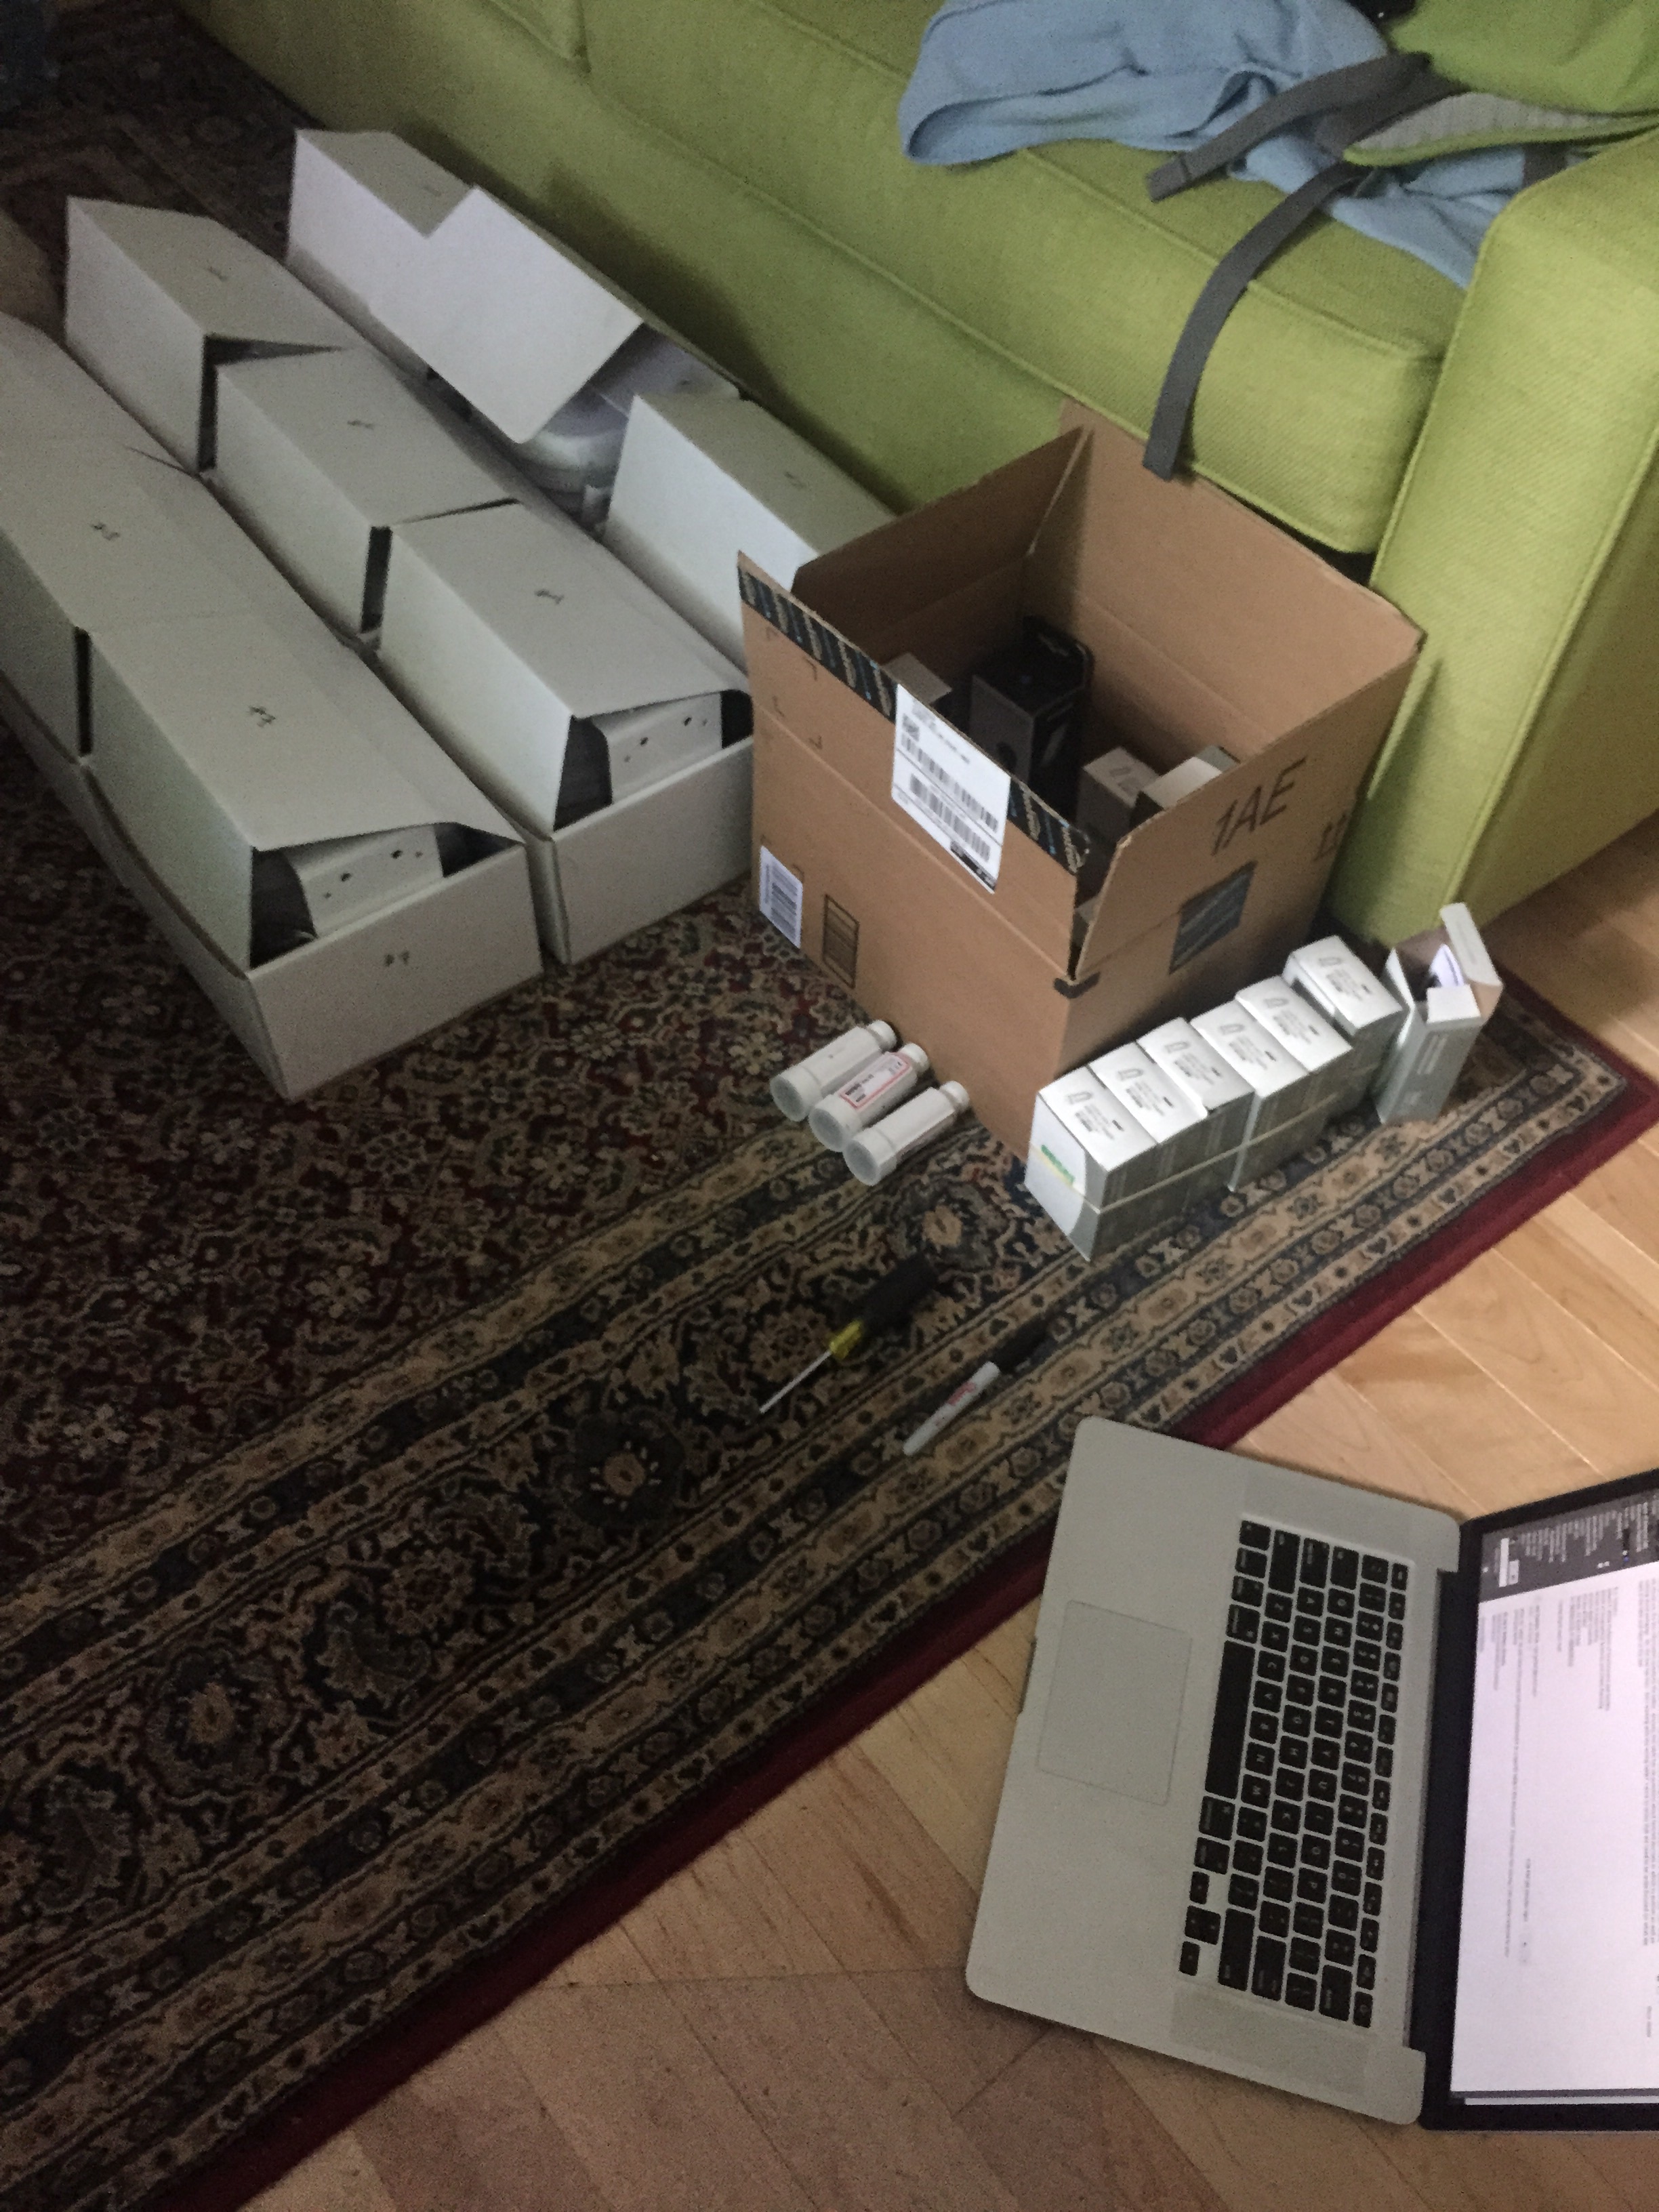
My last post indicated I was testing the equipment. That was the easy part. I also had to build 14 solar shades and figure out how to attach the housings to the approved and available infrastructure (road signs and traffic poles).

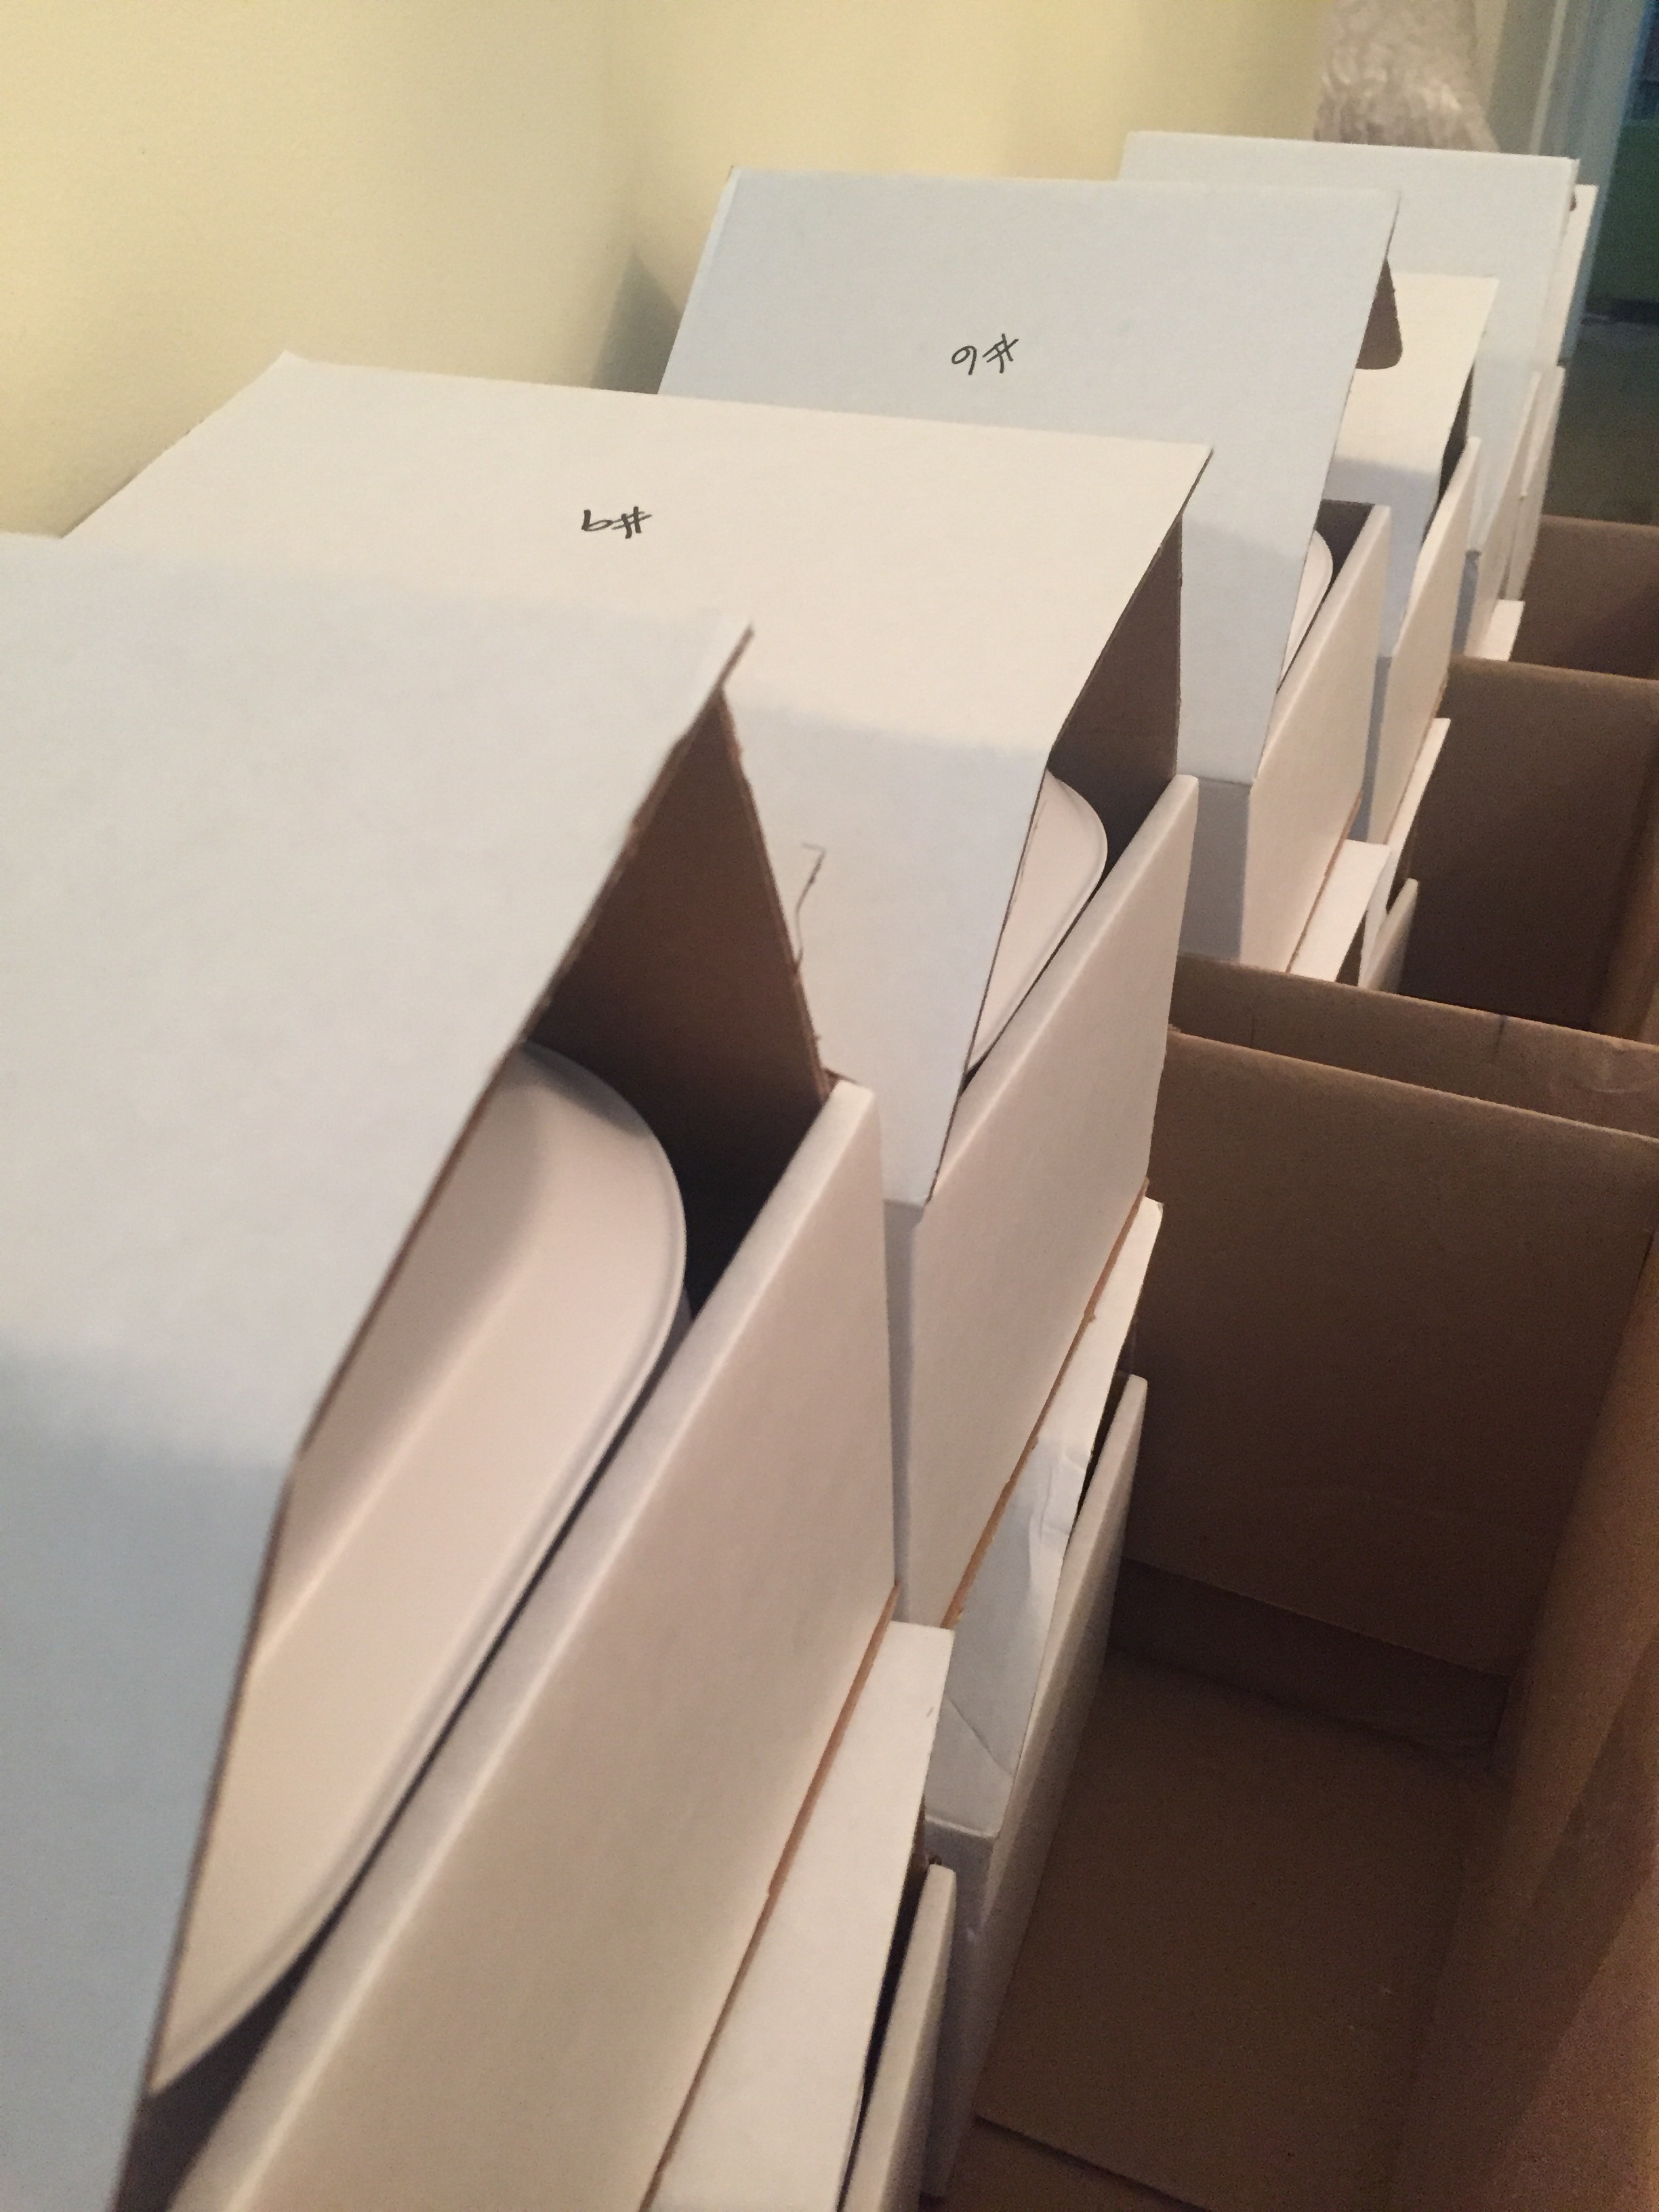
Building the solar shades was easy enough. Before long, there was a pile of them sitting in my living room.

image

The rest meant multiple trips to the hardware store… with kiddo and husband in tow. This worked out well. The kiddo slept (we went right before closing), and since he runs a small OEM (original equipment manufacturing!) parts business, my husband can run around a hardware store naming different types and dimensions of screws, recommend not cutting steel tubes with a chop saw, and tell me how likely the test assembly we threw together is to rust in a salt fog test. Hopefully there is no salt fog in Durham.

image

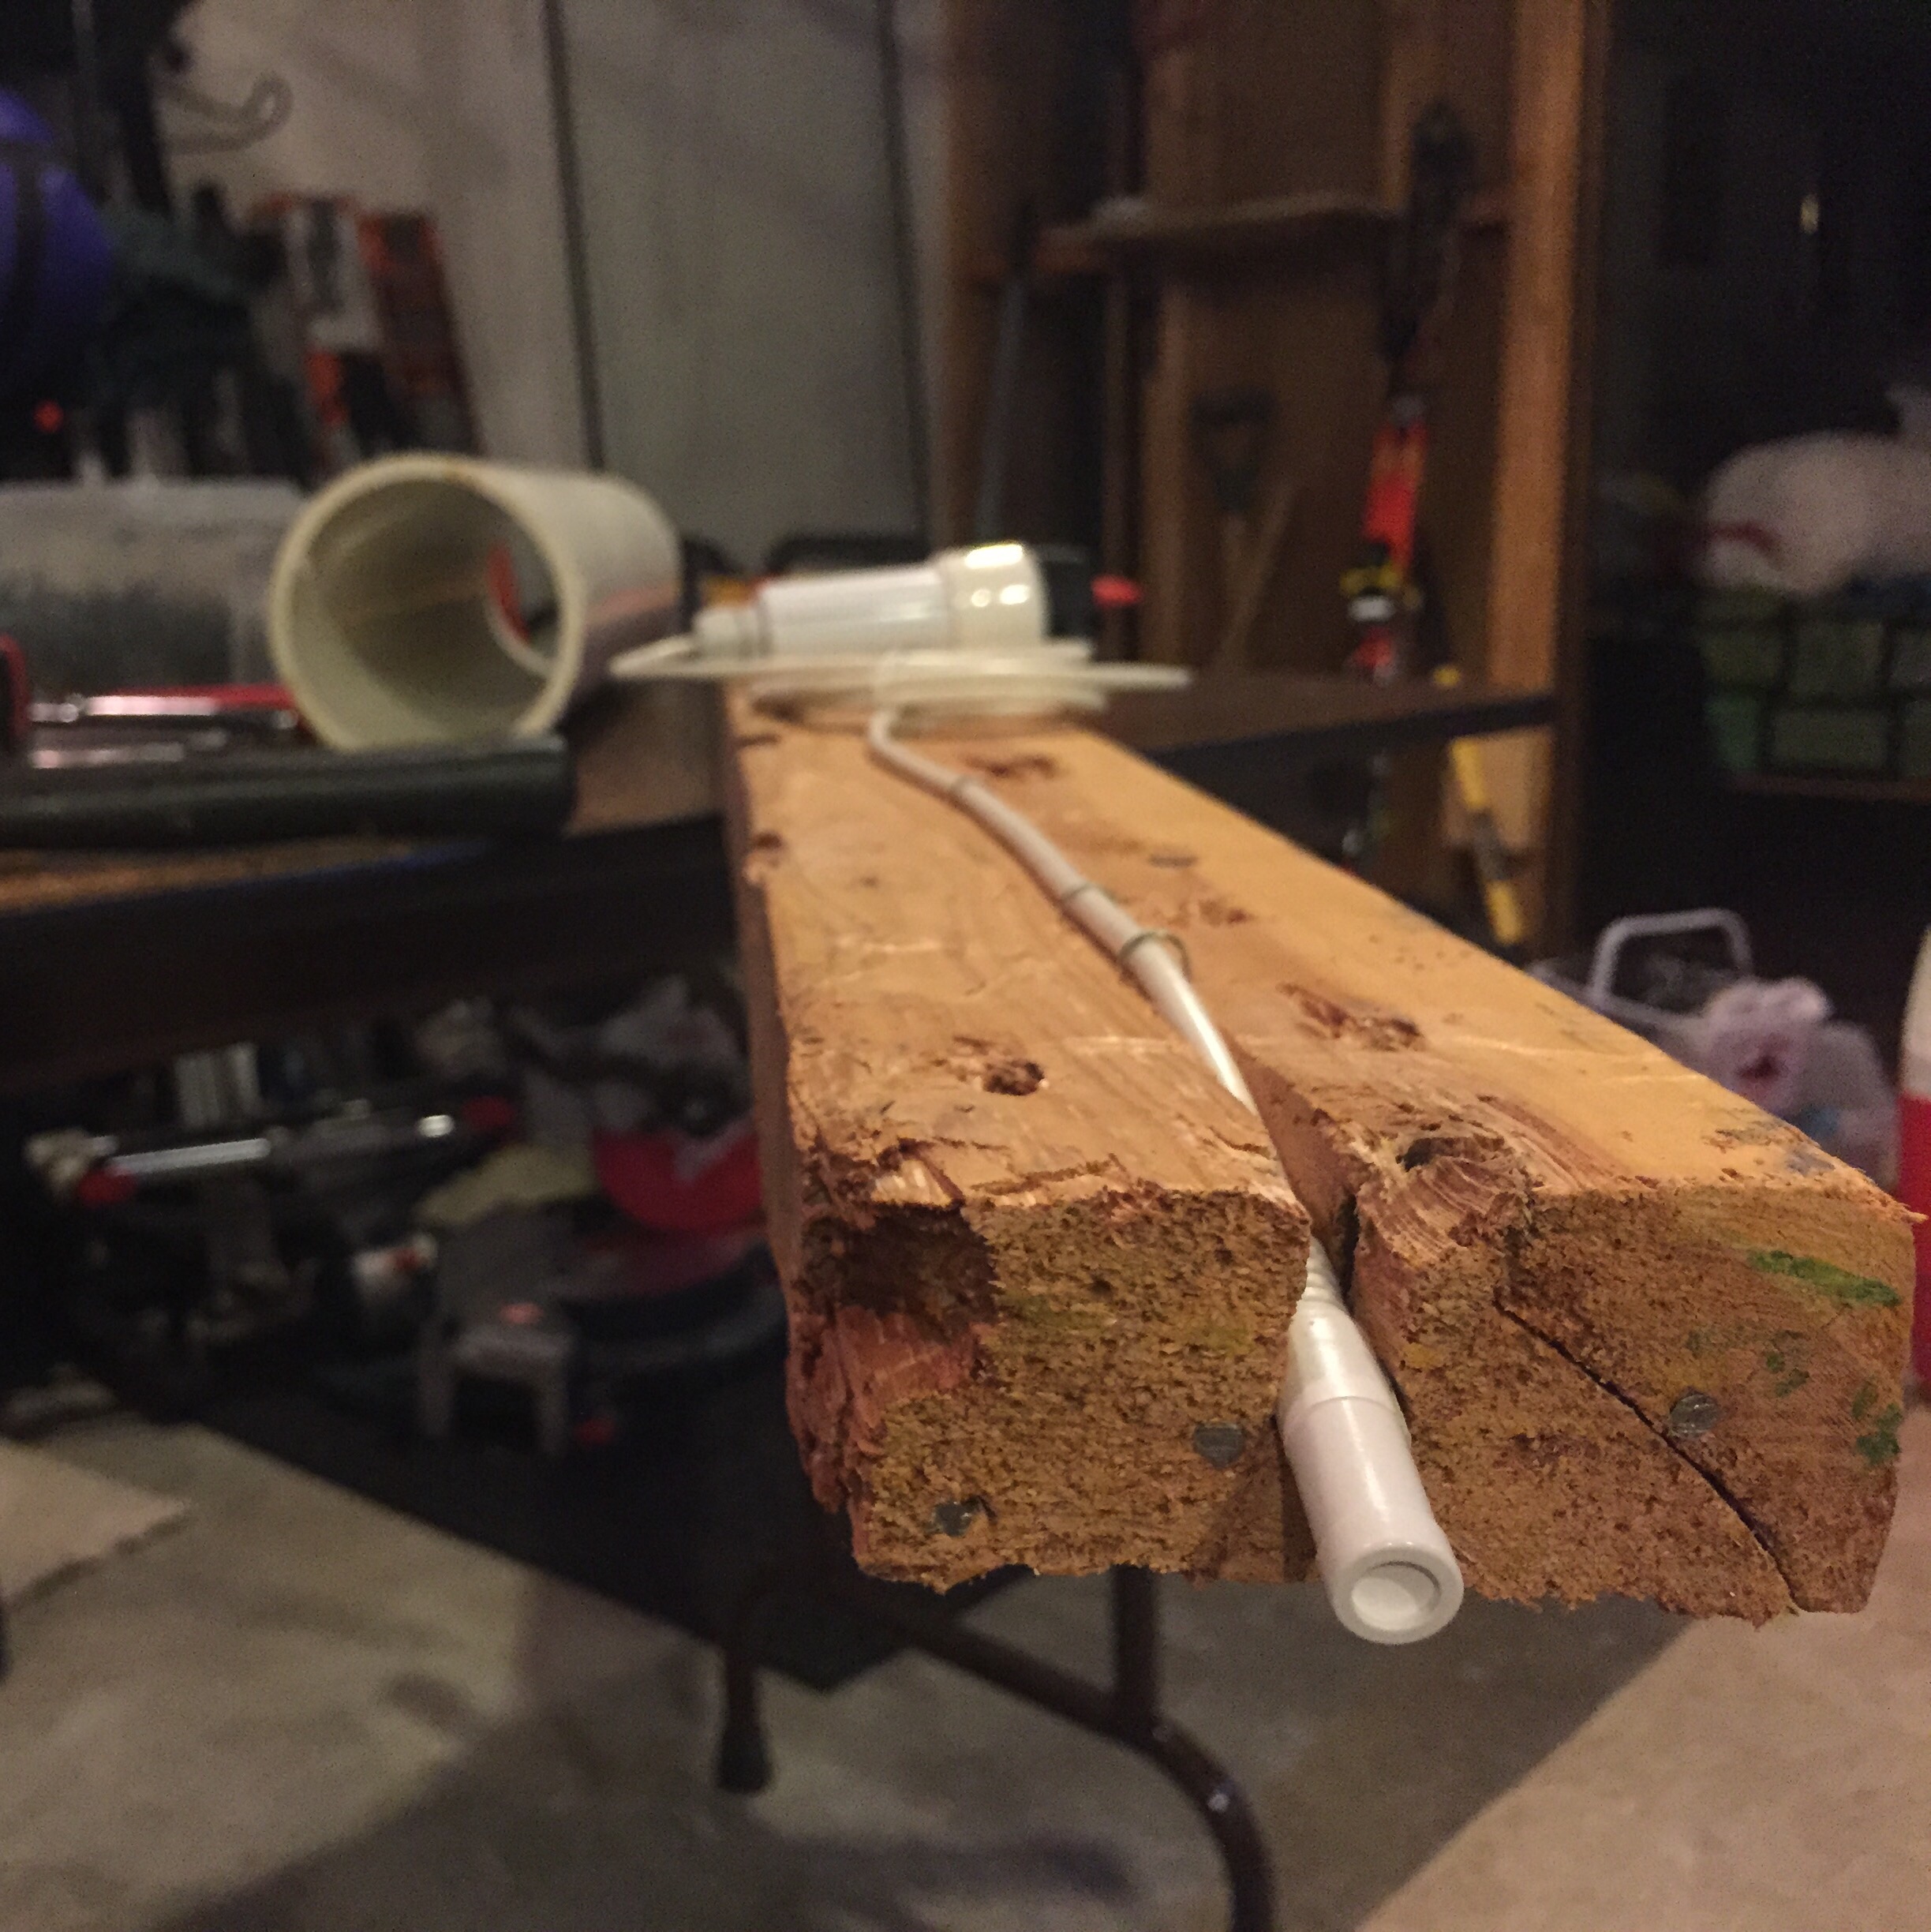
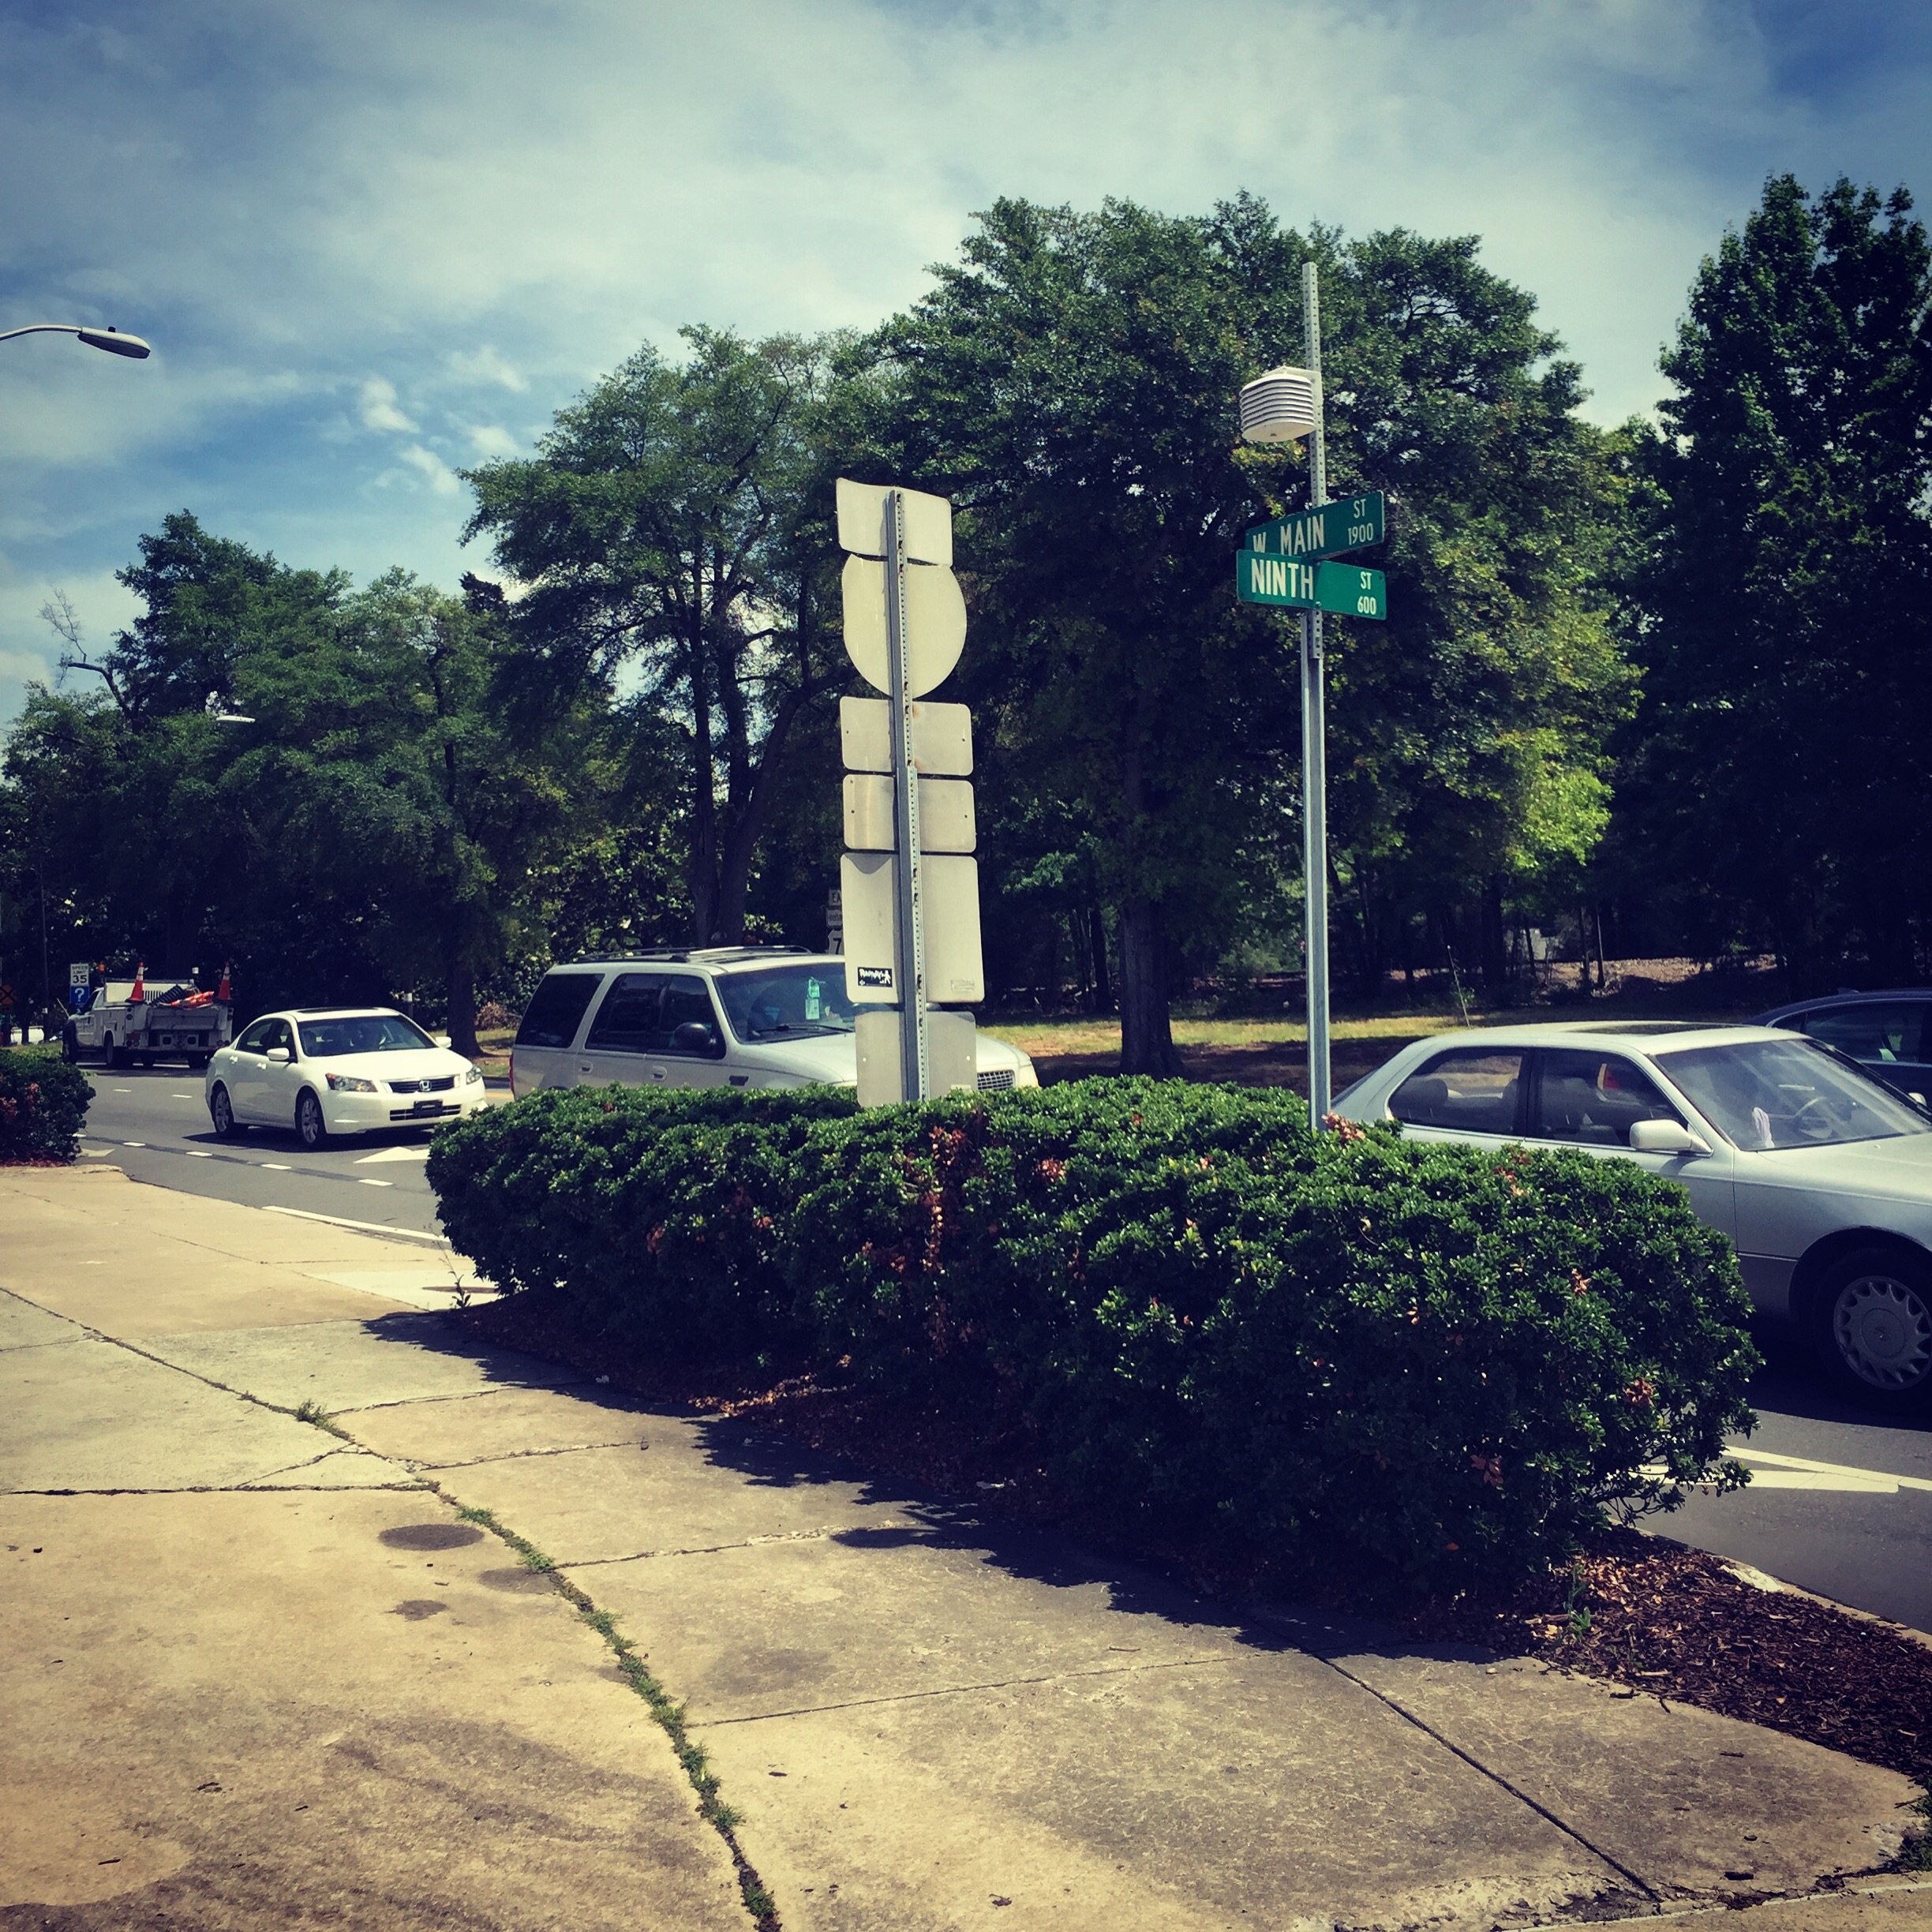
The sensors and housing are attached to two types of infrastructure: street signs, and traffic poles. The traffic poles were easy. Zip ties, rated for outdoor use and 75 pounds made easy work of installing those six sensors. The street signs required a little more creativity. Rather than buy extra parts, I intended to use as much of the hardware provided by Onset with the solar shade. The plan worked beautifully. A three foot, perforated steel pipe bolted to the mating street sign post, and the solar shade and sensor were attached with an M5 screw and the two U-bolts provided by Onset. But this is getting a little ahead of myself.

With a plan and hardware in hand, the sensors had to be launched and installed in the solar shades.

image

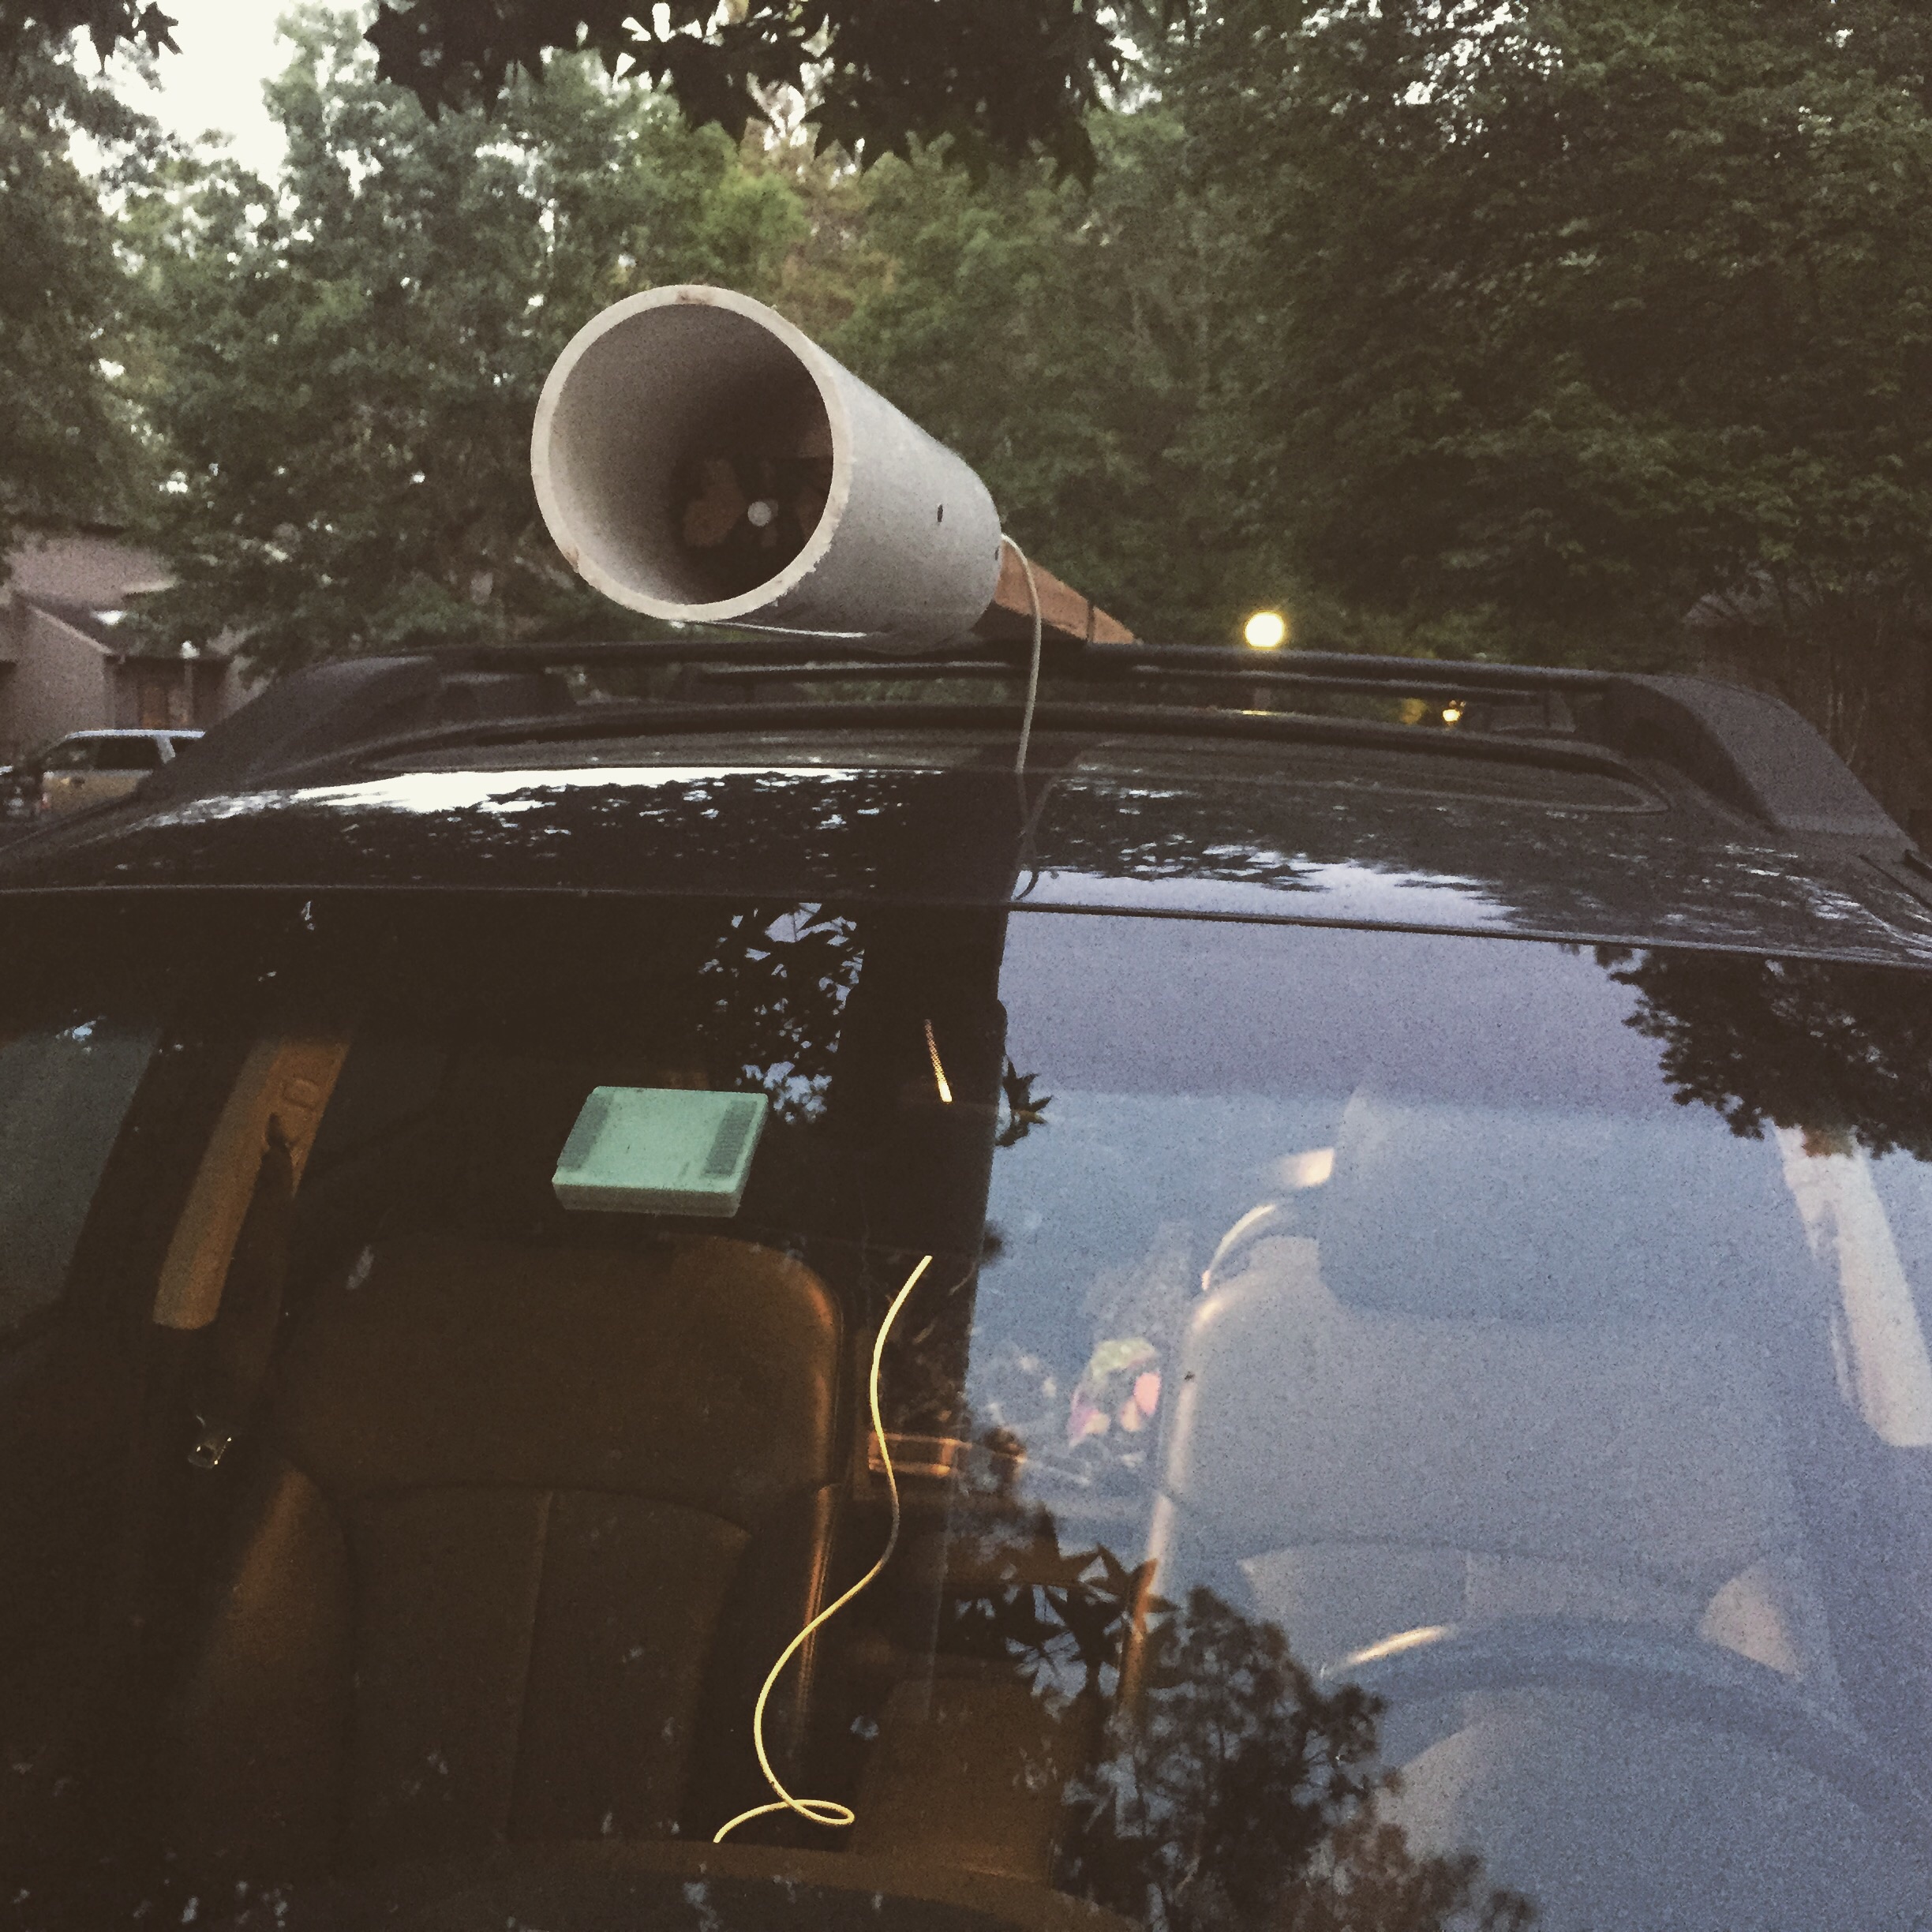
I launched the sensors Monday with a delayed start for Tuesday afternoon. Then everything went into the car: ladder, extra parts, tools, snacks, and a data sheet to record installation time and location.

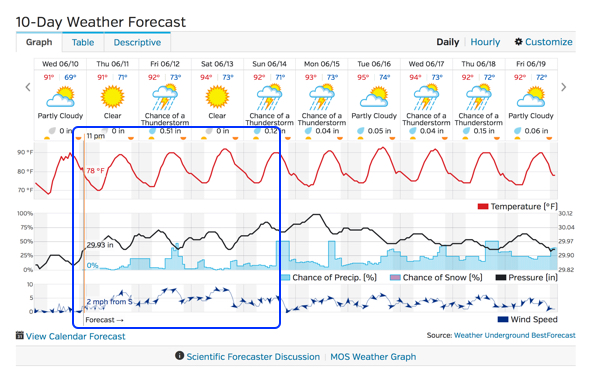
Tuesday promised to be the rainiest day of the week, and I still got lots of volunteers to help with installation. What a great lab team! We started at 9 am and finished around 3:30 pm. A solid day in the field, and it only rained in the morning. Go figure.

image

As of now, there are 12 sensors out in Durham, North Carolina, recording temperature and relative humidity every 15 minutes. If you see one while driving around, give it a wave, and know science is happening NOW!

Next goal: crossing my fingers and hoping each of the sensors is still there when I go back out to collect the data…

Testing, Testing!

Today I am testing equipment!

I have 14 HOBO U23s on the living room floor waiting for deployment, 14 solar shades to build and 1 GPS to master before the official kick off of the summer field campaign. Before anything gets real though, there is testing.

image

Last week I started to build a solar shade only to realize that I had forgotten to order the special clamp required to mount the sensor inside. Rookie mistake. It would be an even more serious downer to spend a whole lot of time setting up sensors in the field only to have them not work properly and lose a chuck of potentially valuable data. So, I’ve got one HOBO mounted to the side of the house over night so I can practice deployment, downloading and reading the data. In the mean time, I will be building out a sun shade, taking the GPS for a walk, and finalizing the build out for mounting the sensors out in the field and to the car.

The fact that I am testing equipment at all means I also got permission to mount the sensors in the field! For that, I owe a special thanks to my contacts in the Durham Transportation Office for their time and effort reviewing and approving the plan. Further proof research never happens in a bubble.