
THE REGIONAL URBAN HEAT ISLAND
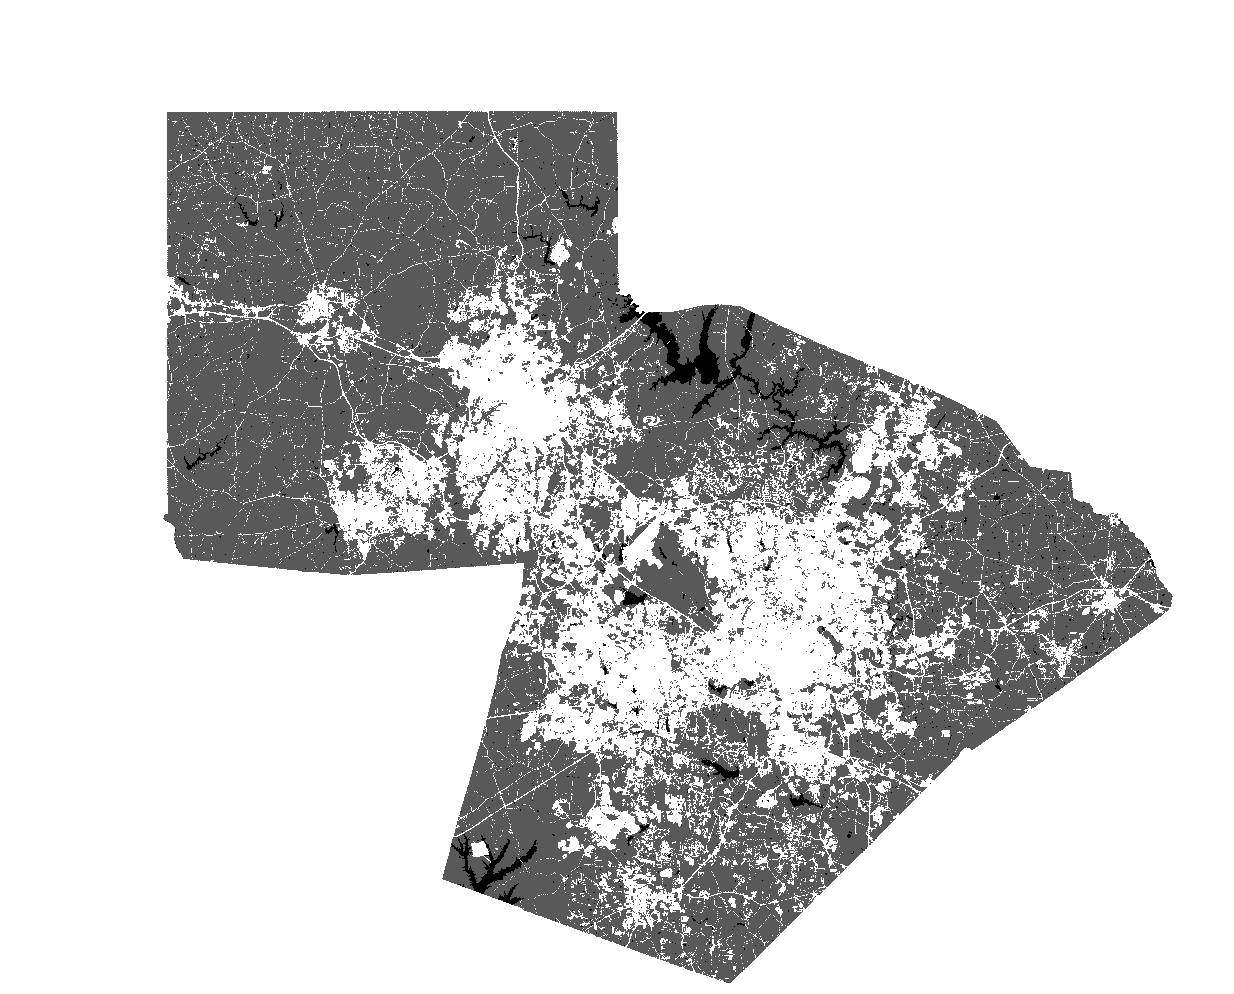
The figure above shows the distribution of the urban and rural land cover classes in Orange, Durham and Wake Counties of North Carolina. These distributions were found by aggregating 20 land cover types from the NLCD 2011 data product into two groups: urban (white) and rural (dark gray). Open water appears black. Using GIS software and a thermal image of the study area taken from the Landsat-8 satellite, I calculated the average temperature of the two different land classes for a hot summer afternoon earlier this year (June 21, 2015, 3:52pm). The temperature of the rural land cover in this image is 2.1 degrees Celsius cooler than the urban areas. This result will appear in a forthcoming paper characterizing the regional UHI by multiple methods.
MOBILE TRANSECT AND STATIONARY NETWORK LOCATIONS
The following shows the preliminary mobile transect route that will be traversed multiple time this summer. The map also shows the location of the stationary sensors around the City of Durham, NC. Sensors are installed on city light poles and road signs and will be deployed until September.

One Reply to “”